


Last Updated: October 2026
Terminal value is the part of a discounted cash flow model that covers every year after the forecast ends. In most valuations it is the largest single number in the result. Two methods produce it. One is the perpetuity growth model. The other is the exit multiple method. They rest on different logic, yet they should land close together. When they do not, the forecast is usually the problem, not the math.
The team at Sofer Advisors builds and reconciles both methods on every engagement, backed by Inc. 5000 recognition in 2024 and 2025. A number that drives most of the answer deserves a second opinion from inside the same model. This guide shows how each method works, the one rule that keeps the perpetuity version honest, and why the two figures should agree.
Key Takeaways
- What terminal value is: it is the value of every cash flow after the explicit forecast period, often the majority of a DCF result.
- Two methods: the perpetuity growth model grows the final cash flow forever, while the exit multiple method applies a market multiple to a final-year metric.
- The r greater than g rule: the discount rate must exceed the long-term growth rate, or the perpetuity formula breaks down.
- They should reconcile: the two methods describe the same company, so a wide gap points to a shaky forecast or a poorly fitted multiple.
- Review the driver: when terminal value is most of the answer, the assumptions behind it carry the whole report.
Each of these pieces ties into the wider valuation. The sections below take them one at a time.
Why Is Terminal Value Calculation Important to Understand?
Terminal value usually decides the headline number in a DCF. In many models it is well over half of the total value. That means the quality of the whole report hinges on a handful of long-range assumptions. Get the growth rate or the multiple wrong and the error flows straight into the final figure. An owner who understands how the terminal value is built can tell a defensible valuation from a hopeful one, which matters most in a sale, a tax filing, or a dispute.
What Is Terminal Value in a DCF?
A DCF forecasts cash flows year by year for a set window, often five to ten years. No one can forecast each year forever, so the model stops the detailed work at the end of that window. Terminal value then captures everything after it. It is the present value of all remaining cash flows under the assumption that the business keeps operating as a going concern.
Think of the model in two parts. The explicit period holds the years you can reason about with specifics. The terminal value holds the long tail you cannot. Both are discounted back to today and added together. Because the tail is long, its present value is often the bigger of the two pieces, which is exactly why the method used to build it carries so much weight.
How Do the Two Terminal Value Methods Work?
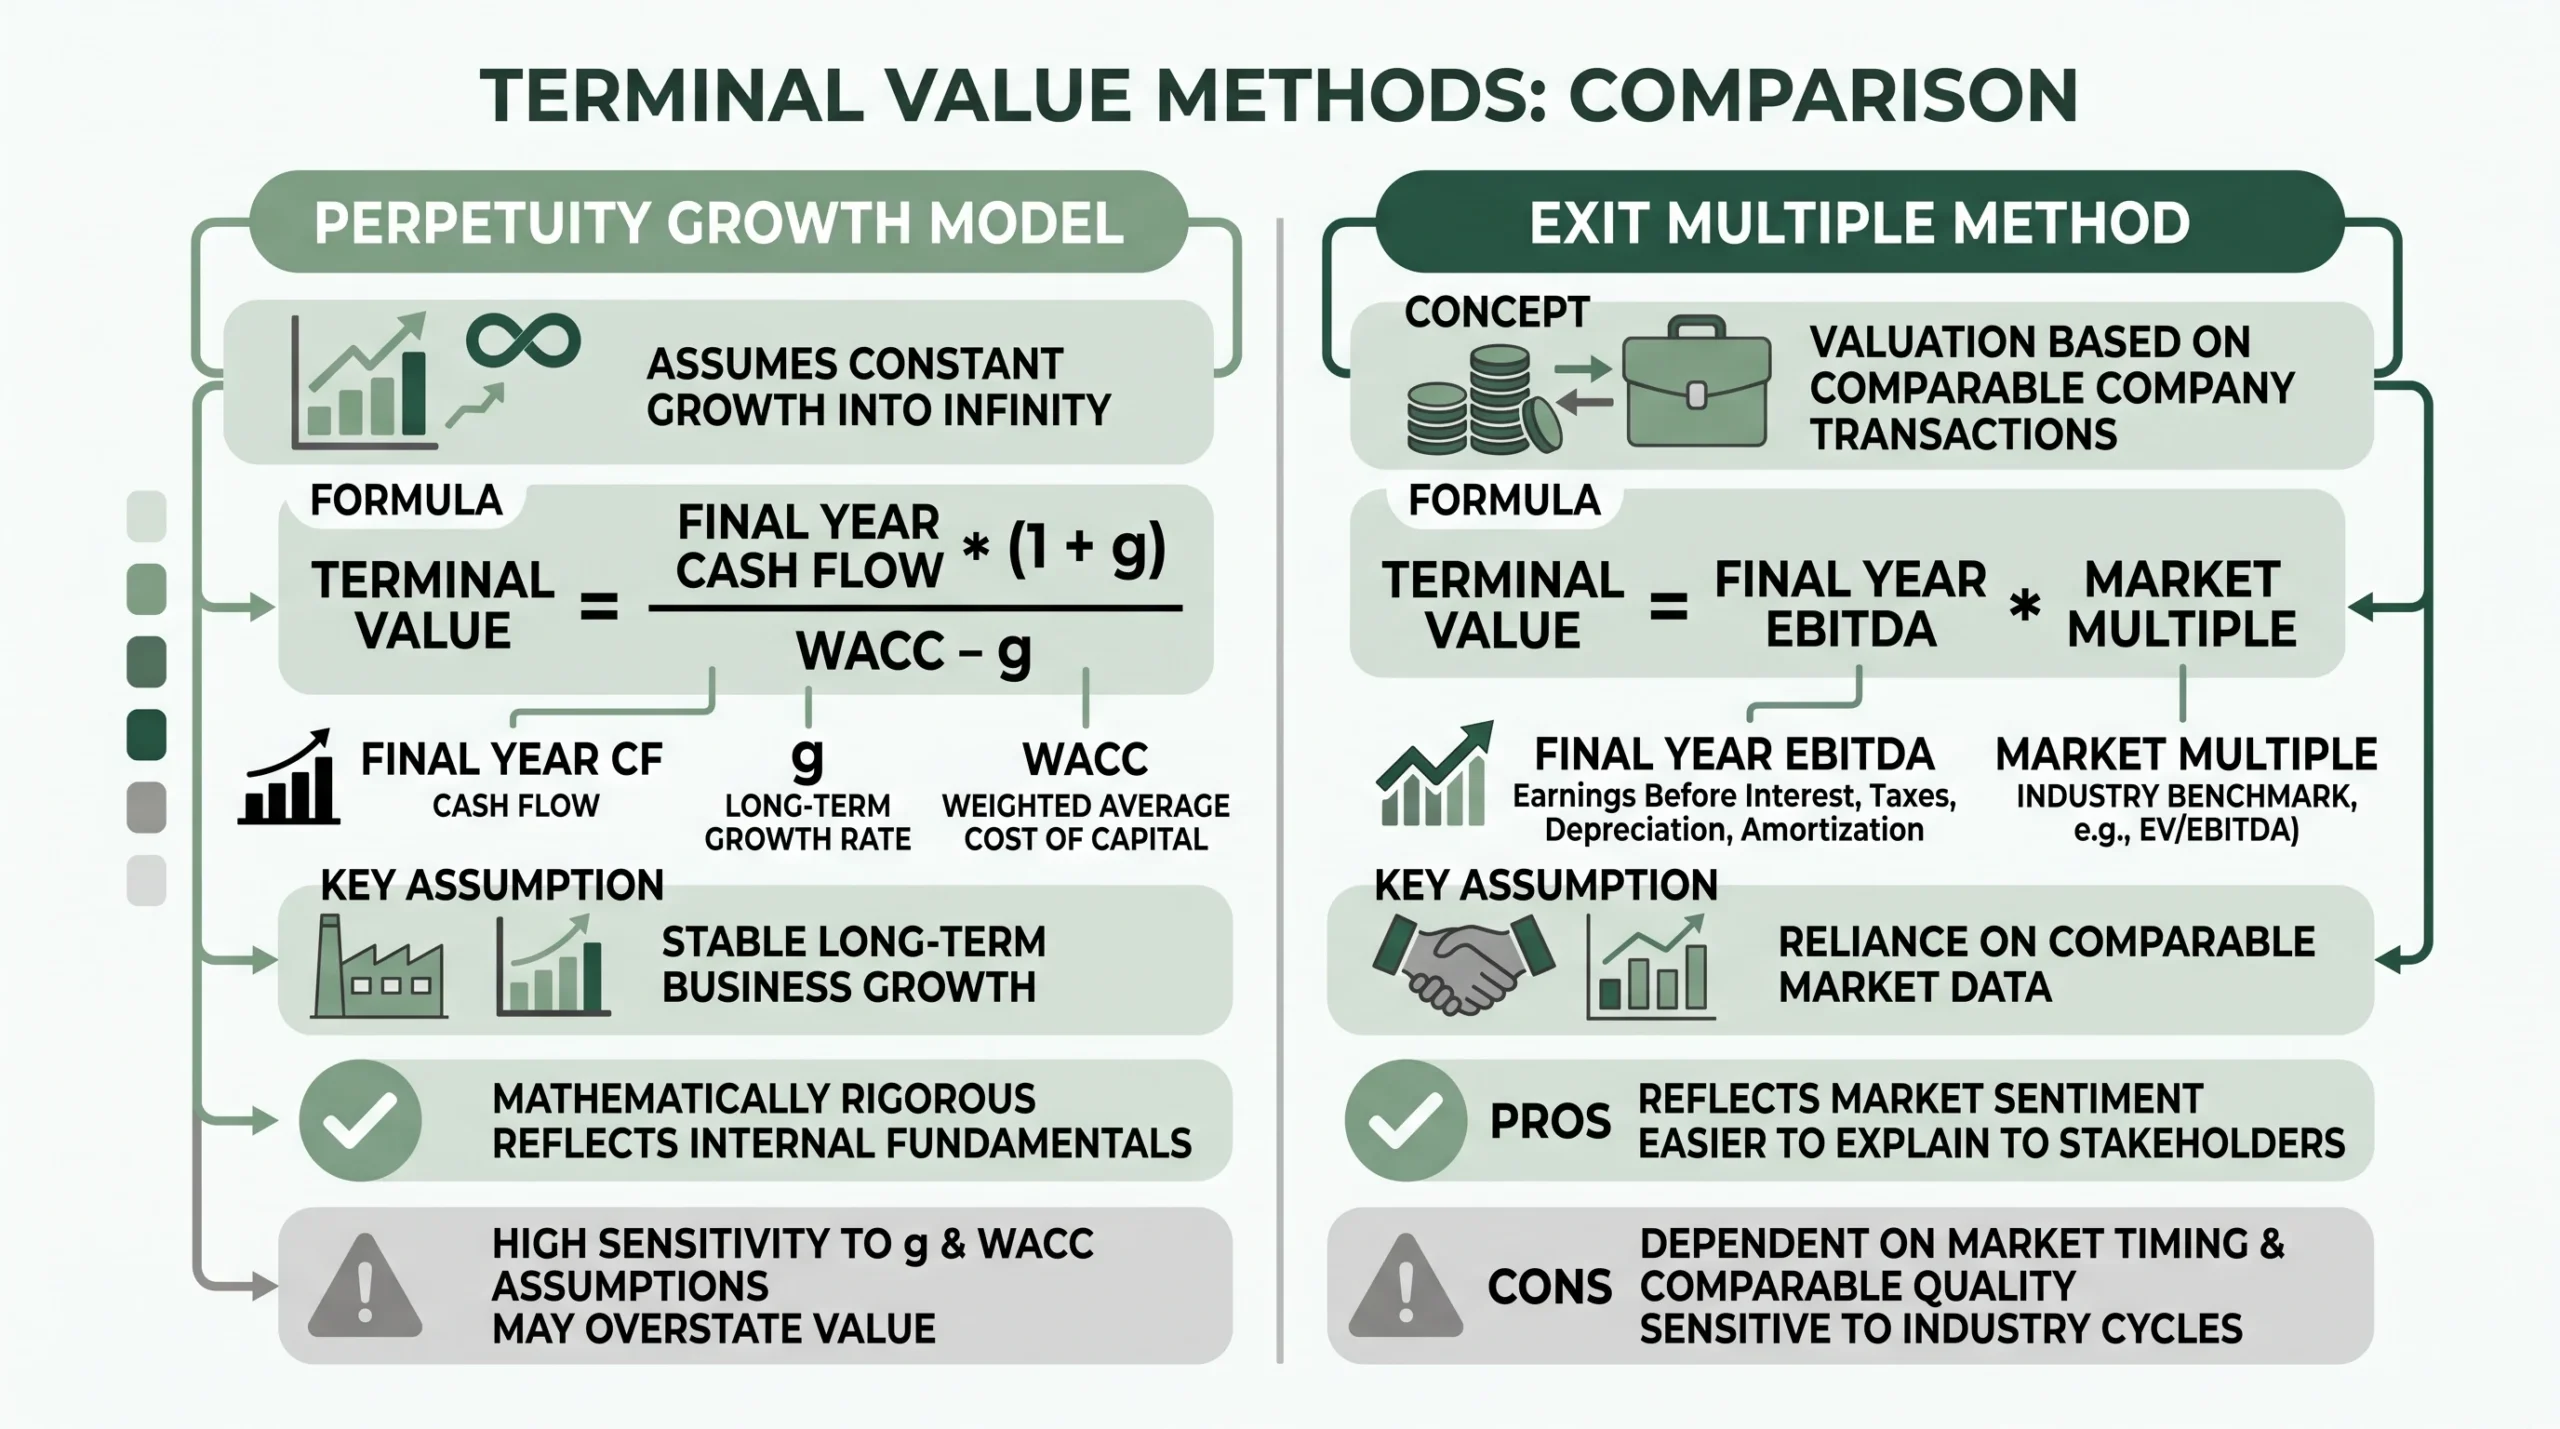
There are two standard ways to calculate terminal value. The perpetuity growth model, also called the Gordon growth model, assumes the final year’s cash flow keeps growing at a steady rate forever. Its formula is final-year free cash flow times one plus the growth rate, divided by the discount rate minus that growth rate. Written out, that is TV = Final-Year FCF x (1 + g) / (WACC – g).
The exit multiple method takes a different route. It assumes the business is sold at the end of the forecast and prices that sale off the market. You apply a valuation multiple to a normalized final-year metric, most often EBITDA, so the figure is final-year EBITDA times a market multiple. One method leans on long-term theory. The other leans on what buyers pay today. Both aim at the same target from opposite directions.
How Does the Perpetuity Growth Model Price Terminal Value?
The perpetuity growth model treats the company as a stream of cash that grows at one steady rate from the final forecast year onward. You take that last year’s free cash flow, grow it by one more year at the rate g, then divide by the discount rate minus g. The discount rate is the Weighted Average Cost of Capital, or WACC. Free cash flow here starts from operating profit after tax, then adds back non-cash charges such as depreciation, the write-off owners claim under Section 167 and report on Form 4562.
The growth rate is the sensitive input. It must sit below the discount rate, and it should not run past long-term economic growth, so most mature companies land in a 2% to 4% range. A rate even a point too high can inflate the value sharply, because the denominator shrinks as g climbs. The discount rate itself draws on market benchmarks, and the government sets minimum interest rates for related instruments under Section 1274. Careful appraisers run a sensitivity test here, moving g and the WACC a little in each direction to see how far the answer swings.
How Does the Exit Multiple Method Price Terminal Value?
The exit multiple method prices the end of the forecast as if the company were sold that year. You take a normalized final-year metric, usually EBITDA, and multiply it by a market multiple drawn from comparable businesses. The result is the assumed sale price at that point, which is then discounted back to today like any other cash flow. Because the multiple comes from real deals, the figure reflects what buyers are paying now rather than a long-range theory.
Picking the multiple is the work. Appraisers screen completed transactions and public trading data for companies close in size, industry, and risk, then adjust for the gaps. Transaction databases such as Business Valuation Resources and its DealStats platform supply the raw deals. The metric itself has to be normalized first, stripping out one-time costs and owner perks so it reflects steady earning power. See how Sofer Advisors applies this in transaction and M&A valuation reports, where the exit multiple often anchors the deal conversation.
Why Should the Two Methods Reconcile?
The two methods start from different inputs, but they describe the same future company. So their terminal values should land close together. When they do, the valuation gains real strength, because two independent paths reached the same place. When they split far apart, something is off. Most of the time it is the forecast. An aggressive growth assumption pushes the perpetuity value up, while the market multiple stays grounded in actual deals and refuses to follow.
That gap is useful. It is a built-in error check that a single method cannot give you. A large difference tells the appraiser to go back and test the growth rate, the WACC, or the choice of multiple before signing off. The point of running both is not to pick a winner. It is to catch a bad assumption before it reaches the final number. A valuation that reconciles the two, and explains any remaining difference, is far harder to challenge.
Who Should Calculate Your Terminal Value?
Owners choose a valuation partner based on the size of the business, the audit or litigation exposure, and the budget. Large national firms such as Alvarez and Marsal, Stout, and Kroll serve big public companies with broad advisory teams. Sofer Advisors focuses on defensible, partner-led valuations for closely held and middle-market businesses, with expert witness testimony in 11+ cases behind its reports and 180+ five-star Google reviews. The table below sets out the common options.
| Provider | Typical role | Best for |
|---|---|---|
| Specialized valuation firm (e.g. Sofer Advisors) | Builds both terminal value methods and reconciles them in the report | Closely held and middle-market businesses needing audit-ready support |
| Large national firm | Broad advisory plus valuation at enterprise scale | Large public companies with complex, multi-entity models |
| In-house finance team | Builds the working model but lacks third-party independence | Internal planning and early-stage scenario work |
Sofer Advisors runs each engagement through a four-phase process it calls The Sofer Difference, moving from Discovery to Diligence to Analysis to Delivery. That structure keeps every terminal value tied to the forecast and the market data behind it. It reflects the Heart of a Teacher approach, which means explaining the reasoning behind a number rather than just handing over a figure. For a terminal value that stands up to review, an independent appraiser supplies both methods and the record that reconciles them.
Frequently Asked Questions
What is terminal value in a DCF analysis?
Terminal value is the present value of every cash flow that comes after the explicit forecast period in a discounted cash flow model. A typical forecast runs five to ten years, and then the terminal value captures the rest of the company’s life as a going concern. It often makes up most of the final number. Sofer Advisors treats it as the figure that deserves the closest review in any valuation report.
How do you calculate terminal value?
You calculate terminal value with one of two methods. The perpetuity growth model divides the final year’s free cash flow, grown one more year, by the discount rate minus the long-term growth rate. The exit multiple method applies a market multiple to a final-year metric such as EBITDA. Sofer Advisors runs both methods on every engagement and then compares the two results before settling on a conclusion of value.
What is the perpetuity growth model formula?
The perpetuity growth model, also called the Gordon growth model, is final-year free cash flow times one plus the growth rate, divided by the discount rate minus that growth rate. The growth rate must stay below the discount rate, or the formula breaks. It also should not exceed long-term economic growth. Sofer Advisors tests the growth rate against the wider economy so the resulting value stays defensible under review.
What is the exit multiple method?
The exit multiple method estimates terminal value by applying a market multiple to a normalized final-year metric, usually EBITDA. The multiple comes from comparable companies and recent deals, so the figure tracks what buyers actually pay. Analysts normalize the metric first to strip out one-time items. Sofer Advisors draws multiples from transaction databases and ties each one to the subject company’s size and risk profile before using it.
What is the r greater than g rule?
The r greater than g rule says the discount rate must be larger than the long-term growth rate in the perpetuity growth model. If growth equals or exceeds the discount rate, the denominator turns zero or negative and the value becomes meaningless. The rule keeps the model inside economic reality. Sofer Advisors checks this relationship on every model so a terminal value never rests on an impossible assumption about growth.
Why should the two terminal value methods reconcile?
The two methods start from different inputs, yet they describe the same future company, so their results should land close together. A wide gap usually points to a forecast that is too aggressive or a multiple that does not fit the business. Reconciling the two is a built-in error check. Sofer Advisors explains any difference between the methods inside the report rather than hiding it behind one number.
Where do exit multiples come from?
Exit multiples come from databases of completed transactions and public company trading, such as Business Valuation Resources and its DealStats platform. Appraisers screen those deals for size, industry, and date, then adjust for differences against the subject company. The goal is a multiple that reflects real buyer behavior. Sofer Advisors documents the source and the screening behind every multiple so a reviewer can follow the logic from start to finish.
How much does a business valuation with terminal value cost?
Most business valuations that rely on a discounted cash flow run from $7,500 to $25,000 and take about two to six weeks, depending on the company and the deadline. The fee covers both terminal value methods and the reconciliation between them. A flat price is quoted before the work starts. Sofer Advisors scopes each engagement first, then sets a fixed fee. Request a free estimate for your situation.
Related Case Studies
- Terminal Value Formula: How to Calculate It in a DCF
- The Gordon Growth Model: Terminal Value in a DCF
- What is a DCF Valuation? Complete Guide to DCF Method
Executive Summary
Terminal value covers all the cash flows after a DCF forecast ends, and it is often the biggest piece of the result. Two methods build it. The perpetuity growth model grows the final cash flow forever and divides by the discount rate minus the growth rate, so the growth rate must stay below the discount rate. The exit multiple method applies a market multiple to a final-year metric such as EBITDA, drawn from comparable deals. The two should reconcile, because they describe the same company. A wide gap signals a forecast that is too hot or a multiple that does not fit, so running both is the error check. The first step is a clean forecast and a growth rate the economy can support.
What Should You Do Next?
Pull together your financial projections, the basis for your long-term growth rate, and a short list of comparable deals, since a clean file supports a defensible terminal value. Confirm that your growth rate sits below your discount rate before the model is final. This guide was prepared by David Hern CPA ABV ASA, founder of Sofer Advisors, an Inc. 5000 firm specializing in neutral third-party valuations. Schedule a free consultation to discuss your specific situation.
People Also Read
About the Author
This guide was prepared by David Hern CPA ABV ASA, founder of Sofer Advisors, a business valuation firm headquartered in Atlanta, GA serving clients across the United States. David holds dual accreditations as an Accredited Senior Appraiser (ASA) and is Accredited in Business Valuation (ABV), credentials recognized by the IRS, SEC, and FINRA. He also holds the Certified Exit Planning Advisor (CEPA) designation. With 15+ years of valuation experience, David has served as an expert witness in 11+ cases across multiple jurisdictions and built Sofer Advisors into an Inc. 5,000-recognized firm with 180+ five-star Google reviews. Its full W2 employee team maintains subscriptions to all major valuation databases and operates under a next business day response policy.
For professional business valuation services, visit soferadvisors.com/about-us/ or contact Sofer Advisors at soferadvisors.com/contact-us/.
This content is for informational purposes only and does not constitute professional valuation advice. Business valuation conclusions depend on specific facts and circumstances. Contact Sofer Advisors for guidance regarding your specific situation.