

Last Updated: April 2026
A terminal value formula is the mathematical expression used in discounted cash flow (DCF) analysis to estimate all future cash flows a business is expected to generate beyond the explicit forecast period, captured as a single present-value figure. Most DCF models project cash flows for five to ten years; terminal value represents everything beyond that window, calculated using either the Gordon Growth Model, which assumes a constant perpetuity growth rate, or the Exit Multiple Method, which applies a market-derived multiple to the final forecast year’s earnings before interest, taxes, depreciation, and amortization (EBITDA). Because it compresses decades of future cash flows into one number, terminal value is almost always the single largest and most sensitive component of any DCF-based business appraisal.
For business owners, understanding how terminal value is calculated and what assumptions drive it is essential for evaluating a valuation opinion, negotiating a sale price, or understanding the implied growth view embedded in a buyer’s offer. Sofer Advisors, a nationally recognized business valuation firm headquartered in Atlanta, GA, applies both terminal value methods across its business appraisal, ESOP, and 409A valuation engagements, selecting the most appropriate approach based on the company’s stage, industry, and the purpose of the valuation.
The two primary terminal value methods are not interchangeable. Each rests on different assumptions about how a business will behave in perpetuity, and the choice between them, along with the specific inputs selected, can shift a company’s concluded value by millions of dollars.
The sections below examine each method, walk through the formula and calculation, explain how appraisers select inputs, and identify how terminal value assumptions affect a formal business appraisal conclusion.
Key Takeaways
- Two Primary Methods: Terminal value is calculated using either the Gordon Growth Model, a perpetuity formula applying a long-term growth rate to free cash flow (FCF), or the Exit Multiple Method, a market-derived EBITDA multiple applied to the terminal year.
- Majority of DCF Value: Terminal value typically represents 60% to 80% of total enterprise value in a DCF, making it the most sensitive and consequential assumption in the entire analysis.
- Perpetuity Growth Rate: The Gordon Growth Model requires a perpetuity growth rate anchored to long-term GDP growth, which for established businesses typically falls between 2.0% and 3.5%.
- Exit Multiple Sourcing: The Exit Multiple Method requires a market-derived EV/EBITDA multiple from comparable public companies or precedent transactions, selected with the same rigor applied in a standalone market approach.
- Both Methods Should Reconcile: Credentialed appraisers typically run both methods and reconcile the results; significant divergence between the two signals that one or more key inputs needs review.
Each of these principles shapes how a credentialed appraiser builds and defends a DCF-based business valuation. The sections below examine each terminal value method in detail, including the formula, inputs, and sensitivity considerations that determine whether the concluded value is defensible under IRS, buyer, or court scrutiny.
What Is the Terminal Value Formula?
The terminal value formula is the mechanism by which a DCF model captures the economic value of a business beyond its explicit forecast window. In a standard DCF model, an analyst projects free cash flows for a defined period, typically five to ten years, then applies a terminal value formula to represent all remaining future cash flows from the end of that period forward. Without a terminal value, a DCF would capture only a fraction of a going-concern business’s total economic worth, since most businesses are assumed to generate cash indefinitely beyond any finite forecast horizon.
There are two primary formulas used in practice. The Gordon Growth Model computes terminal value as TV = FCF × (1 + g) / (WACC – g), where FCF is the normalized free cash flow in the final projected year, g is the perpetuity growth rate, and WACC is the weighted average cost of capital (the discount rate). The Exit Multiple Method computes terminal value as TV = EBITDA × Exit Multiple, where EBITDA is the terminal year earnings and the exit multiple is derived from comparable public company trading multiples or precedent M&A transactions. Both formulas produce a terminal value as of the end of the explicit forecast period, which is then discounted back to the present at the WACC to arrive at its present-value contribution to total enterprise value (EV).
How Do You Calculate Terminal Value in a DCF?
Calculating terminal value in a DCF requires completing the explicit forecast period, selecting the appropriate method and inputs, and discounting the result back to the present. Both methods follow the same general sequence but differ in how the terminal value itself is derived. The Gordon Growth Model uses a perpetuity formula grounded in economic assumptions; the Exit Multiple Method uses market data as its anchor. Applying both and comparing the results is standard practice for credentialed appraisers because agreement between the two methods increases confidence in the concluded value.
For the Gordon Growth Model, the steps are as follows, each requiring deliberate input selection rather than arbitrary assumption:
- Step 1: Determine the normalized free cash flow in the final projected year, adjusting for any non-recurring items or capital expenditures that would not continue in perpetuity.
- Step 2: Select the perpetuity growth rate (g), typically anchored to long-term nominal GDP growth, usually 2.0% to 3.5% for U.S. businesses.
- Step 3: Determine the WACC, which serves as the discount rate for both the explicit period cash flows and the terminal value.
- Step 4: Apply the formula: TV = FCF × (1 + g) / (WACC – g). For example, if FCF is $2,000,000, g is 3%, and WACC is 12%, then TV = $2,000,000 × 1.03 / (0.12 – 0.03) = $2,060,000 / 0.09 = $22,889,000.
- Step 5: Discount the result back to the present: PV of TV = TV / (1 + WACC)^n, where n equals the number of years in the explicit forecast period.
For the Exit Multiple Method, the calculation replaces the perpetuity formula with a market-derived EV/EBITDA multiple applied to the terminal year EBITDA. The resulting terminal value is then discounted to the present at the same WACC. Financial modeling platforms including Wall Street Prep and CFI document both approaches in their DCF training programs, noting that the Gordon Growth Model is more theoretically rigorous while the Exit Multiple Method provides a market-anchored cross-check that is often easier to communicate to buyers and boards.
| Gordon Growth Model | Exit Multiple Method | |
|---|---|---|
| Formula | TV = FCF × (1 + g) / (WACC – g) | TV = EBITDA × Exit Multiple |
| Key inputs | Normalized FCF, perpetuity growth rate (g), WACC | Terminal year EBITDA, EV/EBITDA multiple from comparable companies or transactions |
| Primary sensitivity driver | Perpetuity growth rate (g) — small changes shift TV by 15-30% | Quality and representativeness of the comparable company or transaction set |
| Strengths | Theoretically grounded; captures long-run economic assumptions explicitly | Market-observable; easier to communicate to buyers, boards, and courts |
| Best use case | Stable, predictable cash flow businesses; IRS, ESOP, or litigation contexts requiring theoretical rigor | M&A transactions; when robust comparable public company or precedent transaction data is available |
What Is the Gordon Growth Model for Terminal Value?
The Gordon Growth Model, named after economist Myron Gordon, treats a business as a growing perpetuity that generates cash flows at a constant rate forever. The formula, TV = FCF × (1 + g) / (WACC – g), has three critical inputs: the terminal free cash flow, the perpetuity growth rate, and the discount rate. Of these three, the perpetuity growth rate is the most sensitive because it appears in the denominator as WACC minus g. Even a 0.5% change in g can shift the terminal value by 10% to 20% depending on the spread between WACC and g, making the growth rate the single most contested assumption in any DCF-based appraisal or litigation.
According to Damodaran Online (2024), terminal value represents between 60% and 80% of total enterprise value in most DCF analyses of going-concern businesses, a concentration of value that underscores how much weight a seemingly small growth rate assumption carries in the final valuation conclusion. For this reason, the perpetuity growth rate must be grounded in a defensible economic rationale. Credentialed appraisers typically anchor the rate to long-term nominal GDP growth, then adjust based on the company’s competitive position, reinvestment requirements, and industry dynamics. Setting g higher than the economy’s long-term nominal growth rate implies the subject company will eventually become larger than the entire economy, an assumption that is difficult to defend in any IRS review, audit, or expert witness proceeding.
What Is the Exit Multiple Method for Terminal Value?
The Exit Multiple Method calculates terminal value by applying a market-derived EV/EBITDA multiple to the company’s EBITDA in the final projected year. The formula, TV = EBITDA × Exit Multiple, is structurally simpler than the Gordon Growth Model but depends entirely on the quality of the comparable company or transaction data used to select the multiple. A poorly chosen comparable set or an exit multiple drawn from an unrepresentative transaction will produce a terminal value that does not reflect the subject company’s actual market position, regardless of how precisely the rest of the DCF is constructed.
According to AICPA Forensic and Valuation Services (2023), the exit multiple applied in a DCF terminal value calculation should be selected using the same analytical rigor and comparable company discipline applied in a standalone market approach valuation, since the two methods should produce directionally consistent results when the inputs are appropriately sourced. The Exit Multiple Method is most useful when comparable public company data is robust and when the subject company’s EBITDA margin and growth profile align closely with the selected peer group. It provides a market-observable anchor that cross-checks the Gordon Growth result and is often easier to defend to a buyer, board, or court because the multiple is grounded in visible transaction or trading data rather than a theoretical perpetuity assumption.
What Is a Good Terminal Value Growth Rate?
A good terminal value growth rate, also called the perpetuity growth rate, reflects the long-run sustainable growth rate of the business given its industry, competitive position, and macroeconomic environment. For most established U.S. businesses, the perpetuity growth rate falls between 2.0% and 3.5%, consistent with long-term nominal GDP growth expectations. Growth rates above 4% imply the subject company will outgrow the broader economy indefinitely and require a compelling, documented rationale to sustain under challenge.
According to Wall Street Prep (2024), a 1% change in the perpetuity growth rate assumption can shift the terminal value by 15% to 30% depending on the discount rate applied, which is why the growth rate is one of the first inputs challenged by a tax authority, opposing expert, or buyer in any valuation dispute. Companies in high-growth industries may support a modestly higher perpetuity rate; companies in mature or declining sectors should use a rate at or below the GDP baseline. For businesses with significant customer concentration, regulatory exposure, or cyclical revenue, appraisers typically present terminal value across a sensitivity range, from 1.5% to 3.5%, rather than a single point estimate, demonstrating that the concluded value is robust to reasonable variation in the key assumption.
Key factors that influence the appropriate perpetuity growth rate for a business DCF:
- Industry growth outlook: Mature industries with limited secular tailwinds support lower rates; high-demand sectors may support modestly higher rates anchored in documented industry forecasts.
- Company competitive position: Market-leading businesses with defensible moats can sustain growth longer than undifferentiated competitors facing pricing pressure.
- Reinvestment requirements: Companies requiring heavy capital reinvestment to maintain their position may grow revenue but not free cash flow, limiting the defensible perpetuity rate.
- Macroeconomic baseline: Long-term U.S. nominal GDP growth of approximately 2% to 3% is the standard anchor for domestic business valuations absent a specific industry exception.
The perpetuity growth rate should always be set conservatively and supported by documented analysis, since it is among the first assumptions a tax authority, opposing expert, or opposing counsel will examine in any valuation dispute or litigation context.
Schedule your free consultation with Sofer Advisors to understand how terminal value growth rates are selected in your company’s specific appraisal context and how they affect your concluded fair market value, and discover The Sofer Difference.
How Does Terminal Value Affect a Business Appraisal?
Terminal value affects a business appraisal in two direct ways: it drives the majority of total enterprise value in any DCF analysis, and it is the assumption most likely to be challenged by a buyer, IRS examiner, opposing expert, or court. Because terminal value represents 60% to 80% of a DCF’s enterprise value conclusion, even a modest change in the growth rate or exit multiple produces a material shift in the concluded fair market value of the business, with compounding effects on equity value per share in ESOP and 409A contexts.
National valuation firms such as Kroll and Stout apply both terminal value methods in their DCF analyses and reconcile the results before finalizing their value indications; Sofer Advisors follows the same methodology under AICPA and ASA professional standards, with direct ABV and ASA credentialed oversight on every engagement rather than delegation to junior staff. For business owners, understanding the terminal value assumption embedded in any appraisal opinion is important because it represents the appraiser’s explicit view about the company’s long-run cash flow trajectory. A valuation built on an aggressively high perpetuity growth rate may produce a higher number but is more exposed to challenge; a conservatively set terminal value is more defensible and more likely to hold up in a sale negotiation, IRS audit, or dispute proceeding.
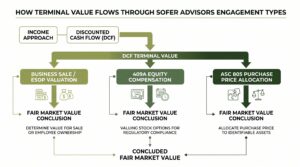
Sofer Advisors applies terminal value in three primary engagement types where the income approach is the primary or supporting method:
- Business valuation for sale or ESOP: Terminal value anchors the DCF indication, which is then reconciled with a market approach before arriving at the final concluded fair market value.
- 409A valuation for equity compensation: Terminal value is applied in the DCF analysis used to establish common stock fair market value to meet IRC Section 409A safe harbor requirements.
- Purchase price allocation under ASC 805: Terminal value may be embedded in the income approach used to value acquired customer relationships, technology, or other intangible assets recognized in a post-merger allocation.
In each engagement type, the terminal value method selection, growth rate, exit multiple, and sensitivity analysis are documented in the appraisal report and reviewed for consistency with the market approach conclusion before the final value is communicated.
Frequently Asked Questions
What is the terminal value formula?
The terminal value formula is the expression used in a DCF model to capture all future cash flows beyond the explicit forecast period as a single present-value number. The two primary formulas are the Gordon Growth Model, TV = FCF × (1 + g) / (WACC – g), and the Exit Multiple Method, TV = EBITDA × Exit Multiple. Both produce a terminal value at the end of the forecast period that is then discounted to its present value using the WACC as the discount rate.
How do you calculate terminal value in a DCF?
To calculate terminal value using the Gordon Growth Model, take the normalized free cash flow in the final projected year, multiply by one plus the perpetuity growth rate, then divide by the WACC minus the perpetuity growth rate. For the Exit Multiple Method, multiply the terminal year EBITDA by a market-derived EV/EBITDA multiple sourced from comparable companies or transactions. Both results are then discounted back to the present at the WACC to arrive at their present-value contribution to total enterprise value.
What is a good terminal value growth rate?
For most established U.S. businesses, a defensible perpetuity growth rate falls between 2.0% and 3.5%, anchored to long-term nominal GDP growth. Rates above 4% imply the business will outgrow the entire economy indefinitely and require strong, documented support. The appropriate rate depends on the company’s industry, competitive position, reinvestment requirements, and the macroeconomic baseline for the relevant market.
What percentage of DCF value is terminal value?
Terminal value typically represents 60% to 80% of total enterprise value in a DCF analysis of a going-concern business. The exact percentage depends on the length of the explicit forecast period, the WACC, and the perpetuity growth rate or exit multiple used. Because terminal value dominates the total DCF result, it is the most consequential and most frequently challenged assumption in any income-approach business appraisal.
What is the difference between the Gordon Growth Model and the Exit Multiple Method?
The Gordon Growth Model estimates terminal value using a theoretical perpetuity framework based on long-run free cash flow and a constant growth rate. The Exit Multiple Method estimates terminal value using a market-derived EV/EBITDA multiple applied to the terminal year EBITDA. The Gordon Growth Model is more theoretically grounded but highly sensitive to the growth rate assumption; the Exit Multiple Method is more market-observable but dependent on the quality and representativeness of the comparable company selection.
What happens if the growth rate exceeds the WACC in the Gordon Growth formula?
If the perpetuity growth rate (g) equals or exceeds the WACC in the Gordon Growth formula, the denominator becomes zero or negative, producing a mathematically undefined or negative result. This constraint enforces economic reality: no business can grow faster than its cost of capital indefinitely. If a DCF model produces this result, the growth rate assumption must be reviewed and reduced to a level below the WACC before the model can generate a reliable terminal value.
How does terminal value affect business sale negotiations?
In a sale negotiation, the buyer’s DCF model implicitly contains a terminal value assumption. A buyer who uses a lower perpetuity growth rate or a lower exit multiple will produce a lower enterprise value and offer a lower price. Sellers who understand how terminal value is constructed can identify when a buyer’s growth rate assumption is conservatively set and use an independent appraisal, which documents a more appropriate growth rate based on the company’s specific financial profile, as a negotiating anchor.
Can terminal value be negative?
Terminal value is negative in the Gordon Growth formula only if the perpetuity growth rate exceeds the WACC, which is a mathematical error rather than an economic condition. In practice, terminal value should always be positive for a going-concern business generating positive free cash flows. A negative terminal value signals an input error, most commonly a growth rate set too high relative to the discount rate, that must be corrected before the model produces a reliable valuation conclusion.
How much does a DCF-based business valuation from Sofer Advisors cost?
A DCF-based business valuation from Sofer Advisors ranges from $7,500 to $25,000 for standard engagements, depending on the company’s revenue, industry, and the complexity of the income approach model required. Engagements are typically completed in four to eight weeks from document receipt. For a fee estimate based on your company’s specific circumstances, contact Sofer Advisors.
Related Case Studies
- Deferred Compensation Dispute: Precise Valuation Changed the Outcome
- Divorce Business Valuation: Resolving Conflict Through Expert Analysis
- Valuation Timing: Why the Right Date Changes Everything
Executive Summary
The terminal value formula captures all future cash flows beyond a DCF model’s explicit forecast period as a single present-value figure, typically representing 60% to 80% of total enterprise value in a business appraisal. The two primary methods are the Gordon Growth Model, TV = FCF × (1 + g) / (WACC – g), and the Exit Multiple Method, TV = EBITDA × Exit Multiple. Both require carefully selected inputs: a perpetuity growth rate anchored to long-term GDP growth for the Gordon Growth Model, and a market-derived EV/EBITDA multiple from comparable companies for the Exit Multiple approach. Sofer Advisors applies both methods in its DCF-based business appraisals, ESOP valuations, and 409A engagements, reconciling results to produce concluded values that are documented, defensible, and credentialed under AICPA and ASA standards.
What Should You Do Next?
If your company is undergoing a business valuation for a sale, ESOP, 409A, or shareholder dispute, the terminal value assumption in the income approach will drive the majority of your concluded fair market value. David Hern CPA ABV ASA, founder of Sofer Advisors, and his team of 14 credentialed valuation professionals apply both terminal value methods across every income-approach engagement, selecting inputs that are documented, market-supported, and defensible to the IRS, buyers, or opposing experts. Schedule your free consultation to understand how terminal value assumptions would be developed in your company’s specific valuation context.
People Also Read
- WACC for Business Valuation: Calculation and Application
- EBITDA Multiple for Business Valuation by Industry
About the Author
This guide was prepared by David Hern CPA ABV ASA, founder of Sofer Advisors – a business valuation firm headquartered in Atlanta, GA serving clients across the United States. David holds dual accreditations as an Accredited Senior Appraiser (ASA) and is Accredited in Business Valuation (ABV), credentials recognized by the IRS, SEC, and FINRA. He also holds the Certified Exit Planning Advisor (CEPA) designation. With 15+ years of valuation experience, David has served as an expert witness in 11+ cases across multiple jurisdictions and built Sofer Advisors into an Inc. 5000-recognized firm with 180+ five-star Google reviews. The firm’s full W2 employee team maintains subscriptions to all major valuation databases and operates under a next business day response policy.
For professional business valuation services, visit soferadvisors.com or schedule a consultation.
This content is for informational purposes only and does not constitute professional valuation advice. Business valuation conclusions depend on specific facts and circumstances. Contact Sofer Advisors for guidance regarding your specific situation.


