


Last Updated: July 2026
The Gordon Growth Model values a business as a stream of cash flows that grow at one steady rate forever, using the formula Value = D1 / (k – g). Analysts bring those future payments back to today’s value to give a firm a single present worth, and over the past 7 years this tool has stayed a core way to gauge long-term value. Sofer Advisors offers independent valuation work for the choices covered in this article.
The formula uses three inputs: next year’s expected cash flow, the required return, and the stable growth rate. It works best for firms with steady cash flow and acts as a starting point for talks on price and capital use, giving owners a simple way to check whether the market matches the real long-term picture of their profit.
Sofer Advisors gives focused help on picking the right method, since the choice must fit the deal type and the standards that apply. The team brings deep skill and 180+ five-star Google reviews to each engagement, handling tough valuation questions for owners, CPAs, and attorneys.
Key Takeaways
- Constant Growth Assumption: The Gordon Growth Model finds true value by assuming a firm makes cash flows that grow at a steady rate forever.
- Formula Components: The model defines value as next year’s cash flow divided by the difference between the discount rate and the growth rate.
- Terminal Value Calculation: Analysts often use this model to find terminal value in a multi-stage Discounted Cash Flow analysis.
- Input Sensitivity: The final value reacts sharply to changes in growth and discount rate, effects researchers note in professional standards.
- Required Rate Relationship: The model needs the discount rate to be higher than the growth rate, which avoids invalid results.
Picking a fair growth rate and discount factor is the base for these long-term projections. And the sections below show how business traits shape these inputs and the final value.
What is the Gordon Growth Model formula?
The core formula is Value = D1 / (k – g). Here, D1 is next year’s expected dividend or free cash flow, while k is the cost of equity capital.
The letter g is the steady growth rate that lasts forever. Analysts find D1 from this year’s dividend, called D0, using D0 * (1 + g).
The cost of equity capital, k, covers the investment’s risk, and analysts often find it using the Capital Asset Pricing Model. The growth rate, g, shows a long-term view for the firm. Because the same three inputs drive every result, view the model as one piece of a wider discounted cash flow method rather than a standalone shortcut.
For this model to work, k must always be higher than g. Per Business Valuation Resources (BVR) data, breaking this rule gives an impossible value. Professional bodies such as the AICPA set the practice standards that govern how these inputs are supported and documented.
How does the GGM calculate terminal value?
The Gordon Growth Model (GGM) applies a steady growth rate to the last cash flow of a forecast, then divides that by the gap between the discount rate and the growth rate. As a key part of a multi-stage Discounted Cash Flow (DCF) analysis, it assumes the firm grows at a stable rate forever.
In a standard DCF, analysts project cash flows in detail over a set forecast period. Once it ends, the terminal value sums all future cash flows into one lump sum, the perpetuity value, at the last year of the forecast.
To find today’s value, that lump sum is brought back to the valuation date, often using the Weighted Average Cost of Capital (WACC). This follows American Society of Appraisers guidance, which aligns with the broader appraisal standards.
What are the GGM’s key assumptions and limitations?
The main assumption is that a business grows at one steady rate forever. The model also assumes the firm has stable operations and a constant discount rate over its life.
Because of these needs, the method fits only mature, stable firms. It does not fit startups, high-growth firms, or firms with volatile cash flows, since steady, sure output does not hold for them.
The model reacts strongly to growth and discount rate inputs, so small shifts cause large swings. Analysts often pair it with other discounted cash flow techniques to handle changing patterns, and Sofer Advisors checks a firm’s fit before picking a model.
How do you select the growth and discount rates?
Picking growth and discount rates means weighing past company results against your view of future economic conditions, and the growth rate should stay modest. It is common to tie this figure to long-term nominal GDP growth. A higher rate implies the firm outgrows the whole economy forever, which market evidence rarely supports.
Owners often use the Capital Asset Pricing Model (CAPM) to find the discount rate, adding the risk-free rate, the market risk premium, and a stock beta to derive the cost of equity. The beta shows how much a stock moves versus the broad market, and analysts often use the Kroll Cost of Capital Navigator for solid data. Matching these inputs to current market data keeps the value sound and meets standards for tax or reporting jobs, including the fair market value tests the IRS applies to gift and estate matters.
What are the main alternatives to the GGM?
The Exit Multiple Model is the main option in place of the Gordon Growth Model. It finds terminal value by applying a market multiple to a firm’s metric at the end of a forecast. Analysts often use the EV/EBITDA ratio here to compare the firm against peers or recent deals, multiplying the ratio by the last year’s earnings for a lump-sum exit value.
The Gordon Growth Model focuses on cash flow growth forever, while the Exit Multiple Model assumes the firm reaches a sale point, showing what a buyer might pay. That makes it useful for owners facing a sale, but it needs one key belief: that market trends stay stable for the sector.
The model’s accuracy rests on the right multiple data, so the comparable firms must share traits with the subject firm, including growth, risk, and capital setup. If they do not match, the terminal value may skew. Per Business Valuation Resources, analysts must adjust these multiples for firm-specific traits so the value fits the firm rather than a broad average.
How does the GGM affect business valuation?
The Gordon Growth Model shapes business value through the terminal value, which often makes up over 70% of the total in a DCF, per Business Valuation Resources. Because the result is so sensitive, the growth and discount rate values carry great weight, and inputs that ignore current conditions can push the result far from the market.
To manage this risk, analysts run a sensitivity analysis, testing many pairs of growth and discount rates to build a value range instead of a single number. Watching how these shifts change the total gives a clearer view of value when the future is unsure, vital when you review a financial report.
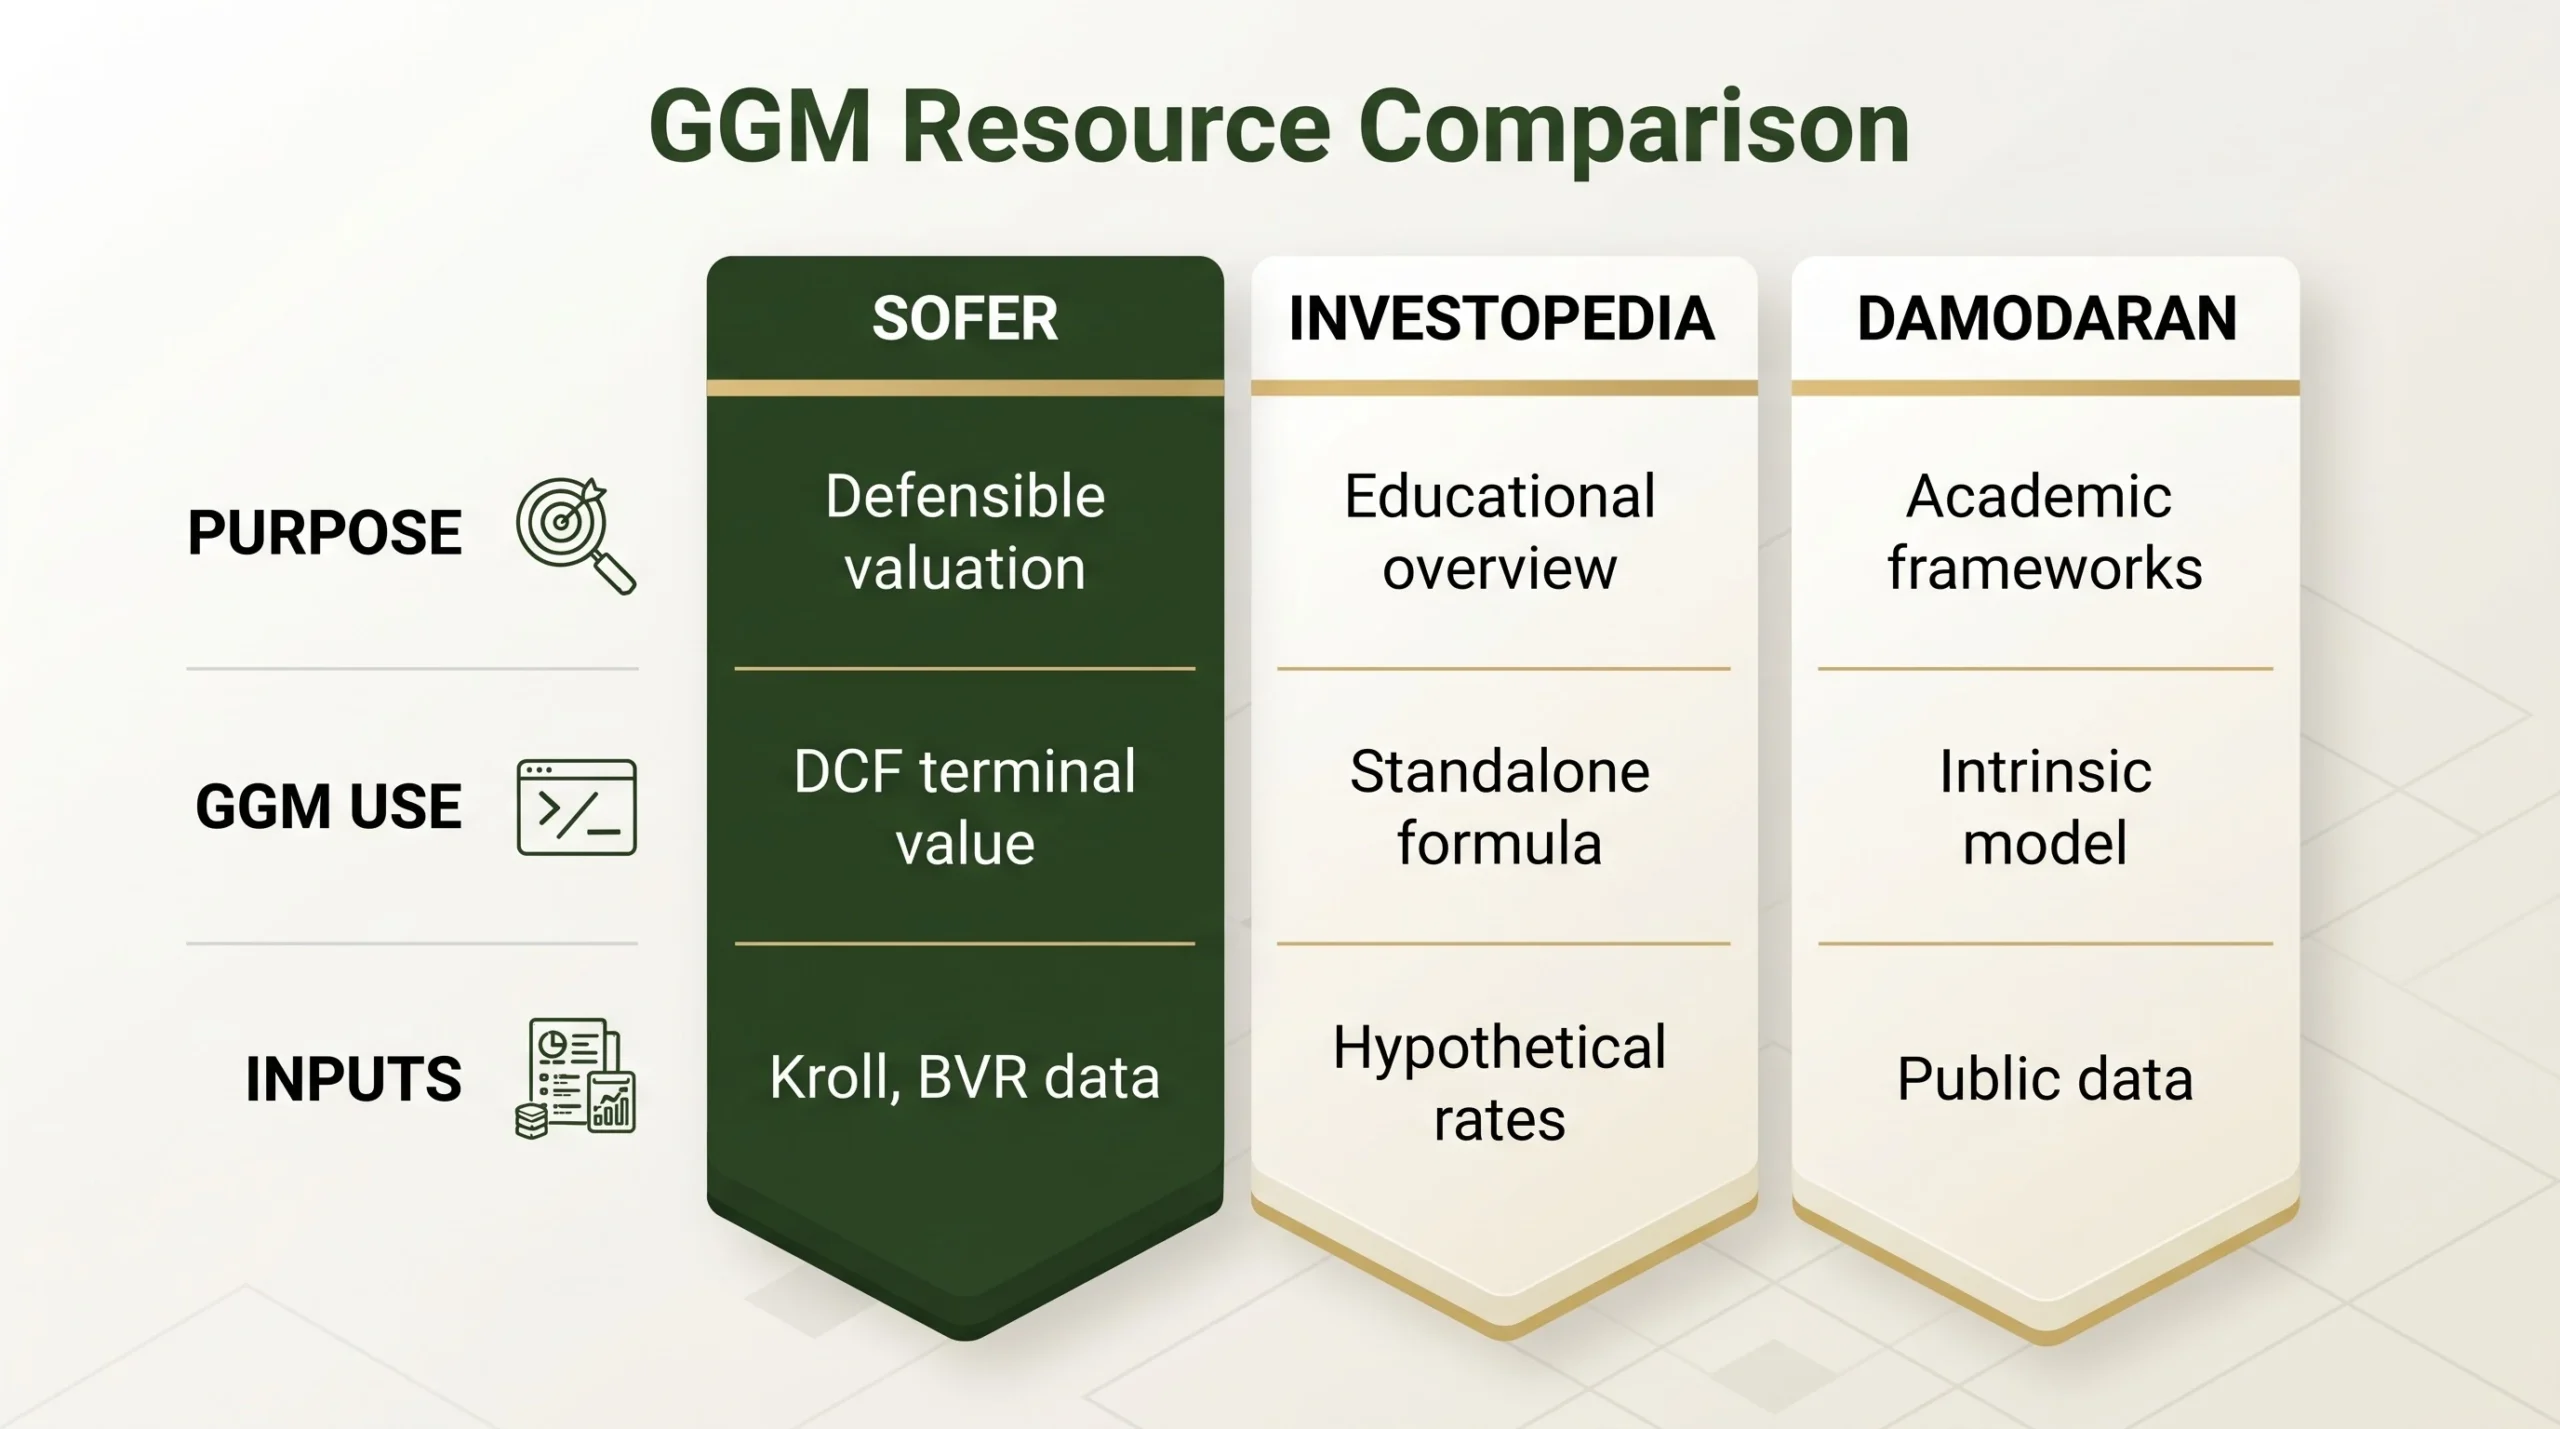
| Feature | Sofer Advisors | Investopedia | Stern.nyu.edu (Damodaran) |
|---|---|---|---|
| Primary Purpose | Deliver a defensible valuation for financial reporting (ASC 820), transactions, or litigation. | Provide a high-level educational overview of the financial concept for retail investors and students. | Offer academic frameworks, datasets, and lecture notes for self-directed valuation analysis. |
| Application of GGM | Used to calculate terminal value in a DCF model as part of a comprehensive valuation analysis. | Explained as a standalone formula for stock valuation, with simplified examples. | Presented as one of several intrinsic valuation models, with access to underlying data. |
| Inputs (g and k) | Derived from specific, subscription-based market data (e.g., Kroll, BVR) for the exact valuation date. | Uses hypothetical rates in examples to illustrate the mathematical calculation. | Provides public historical market data and models (like CAPM) for users to derive their own rates. |
What should the valuation review compare?
A sound analysis ties each big judgment to real proof. That proof comes from records and market data on the valuation date. And the points below sum up the article’s core choices.
| Decision area | Evidence and review focus |
|---|---|
| What is the Gordon Growth Model formula | The core formula for the Gordon Growth Model is Value = D1 / (k – g). |
| How does the GGM calculate terminal value | The Gordon Growth Model (GGM) calculates the terminal value by applying a constant growth rate to the final cash flow of an explicit forecast period and dividing the result by the difference between the discount rate and the growth rate. |
| What are the GGM’s key assumptions and limitations | The main assumption of the Gordon Growth Model is that a business will grow at a single, constant perpetual growth rate for an indefinite period. |
The final report should tie these areas together rather than treat any method or input on its own.
Frequently Asked Questions
Is Gordon Growth DCF?
The Gordon Growth Model is a specific formula. It is used within the terminal value part of a Discounted Cash Flow model. The Discounted Cash Flow is a broad method that projects many years of future cash flows. Meanwhile, the Gordon Growth Model acts as a shortcut standing in for all years after that forecast window.
What is the Gordon model in simple terms?
In simple terms, the Gordon Growth Model treats a business as a lasting stream of cash flows. Those flows grow at a steady, fixed rate each year. It is a way to find what a company is worth today, since it assumes future earnings will rise in a set way forever.
What is the Gordon zero growth model?
The zero growth model is a version of the Gordon Growth Model. Here the growth rate is set at exactly zero percent, so the firm makes the same cash flow forever. The value is found by dividing the yearly cash flow by the discount rate.
How do you calculate D1 in the Gordon Growth Model?
To find D1, take this year’s cash flow or dividend. Then multiply it by one plus the expected growth rate, giving the cash flow expected in the first year of the terminal period.
What happens if the growth rate (g) is higher than the discount rate (k) in the GGM?
Say the growth rate is higher than the discount rate. Then the model gives a negative or impossible result. It’s because the formula needs the discount rate to be higher than the growth rate to account for the risk an investor takes.
What kinds of businesses fit the Gordon Growth Model?
The model fits only mature, stable firms with steady cash flow. It assumes stable operations and a constant discount rate over the firm’s life. It does not fit startups, high-growth firms, or firms with up-and-down cash flows, since the idea of steady, sure output does not hold for them. Sofer Advisors checks this fit before it picks a method.
How much of a DCF’s value comes from terminal value?
Terminal value often makes up over 70% of the total value in a Discounted Cash Flow analysis, per Business Valuation Resources. Because it carries so much weight, the growth rate and discount rate you pick matter a great deal. Inputs that ignore current economic conditions can push the final result far from the market.
What is the Exit Multiple Model?
The Exit Multiple Model is an alternative to the Gordon Growth Model. It finds terminal value by applying a market multiple, often the EV/EBITDA ratio, to a firm’s final-year metric. This assumes the firm reaches a sale point and shows what a buyer might pay in a theoretical exit, which makes it useful for owners facing a sale.
Why do analysts run a sensitivity analysis with the GGM?
The final value reacts sharply to growth and discount rate inputs, so small shifts cause large swings. To manage this risk, analysts run a sensitivity analysis, testing many pairs of growth and discount rates. This builds a value range instead of one single number, giving a clearer view of value when the future is unsure.
Related Case Studies
- Terminal Value Formula: How to Calculate It in a DCF
- What is a DCF Valuation? Complete Guide to DCF Method
- WACC for Business Valuation: Calculation and Application
Executive Summary
The Gordon Growth Model values a business as a perpetual stream of cash flows that grow at one steady rate, using Value = D1 / (k – g), where D1 is next year’s cash flow, k is the cost of equity, and g is the perpetual growth rate. Its main use is to calculate the terminal value inside a multi-stage discounted cash flow analysis, where that terminal figure often exceeds 70% of the total value. The model demands that the discount rate stay above the growth rate, and the growth rate should track long-term nominal GDP rather than optimistic firm-specific hopes. Because the result reacts sharply to both inputs, analysts derive the discount rate through CAPM, source market data from providers like Kroll and BVR, and run a sensitivity analysis to produce a value range. The method fits mature, stable firms and is a poor fit for startups or firms with volatile cash flows, where an Exit Multiple approach may serve better.
What Should You Do Next?
Confirm your firm has the steady, mature cash flows the Gordon Growth Model assumes before you rely on its output, and gather records that support your growth and discount rate inputs. Next, build a sensitivity analysis across several growth and discount rate pairs so you present a defensible value range rather than one fragile number. Finally, have a credentialed analyst review the terminal value assumptions against current market data and applicable standards before you use the figure for a tax, reporting, or sale decision. David Hern CPA ABV ASA, founder of Sofer Advisors provides neutral, defensible valuations for the Gordon Growth Model and DCF terminal value. Schedule a free consultation to discuss your situation.
People Also Read
- What Are the Discounted Cash Flow Techniques? A Guide
- SaaS Valuation: Complete Guide to Software Company Value
About the Author
This guide was prepared by David Hern CPA ABV ASAc, founder of Sofer Advisors, a business valuation firm headquartered in Atlanta, GA serving clients across the United States. David holds dual accreditations as an Accredited Senior Appraiser (ASA) and is Accredited in Business Valuation (ABV), credentials recognized by the IRS, SEC, and FINRA. He also holds the Certified Exit Planning Advisor (CEPA) designation. With 15+ years of valuation experience, David has served as an expert witness in 11+ cases across multiple jurisdictions and built Sofer Advisors into an Inc. 5000-recognized firm with 180+ five-star Google reviews. Its full W2 employee team maintains subscriptions to all major valuation databases and operates under a next business day response policy.
For professional business valuation services, visit soferadvisors.com/about-us/ or contact Sofer Advisors at soferadvisors.com/contact-us/.
Disclaimer: This content is for informational purposes only and does not constitute professional valuation advice. Business valuation conclusions depend on specific facts and circumstances. Contact Sofer Advisors for guidance regarding your specific situation.