


Last Updated: August 2026
The build up method for cost of equity is a way to set the discount rate for a private firm. You begin with a risk-free rate, then stack risk premiums on top of it. Each layer stands for a real source of risk. Data from the Kroll Cost of Capital Navigator shows size premiums vary a lot. They run from under 1 percent for large firms to more than 5 percent for the smallest ones. Sofer Advisors builds each rate from inputs like these.
The method matters because a private firm has no traded stock to read risk from. Each premium answers a plain question about the business: how large it is, how stable its industry, and how much rests on a single owner or client. Add those layers to a safe base rate, and the total becomes the discount rate that turns future cash flow into value today. The rate is only as sound as the evidence behind each layer.
Key Takeaways
- Additive formula: The method adds a risk-free rate, an equity risk premium, a size premium, an industry premium, and a company-specific premium.
- Built for private firms: It fits companies with no public stock, where a market beta cannot be found.
- Objective base inputs: The risk-free rate and premium data come from Treasury yields and the Kroll Cost of Capital Navigator.
- Judgment on the last layer: The company-specific risk premium takes expert judgment. It covers risks like reliance on one key person.
- Different from CAPM: CAPM needs a stock beta. The build up method replaces that single factor with several clear premiums.
These layers add up to one discount rate. Our team then applies that rate in a discounted cash flow model. The sections below show how to build and defend each premium.
What is the build-up method formula?
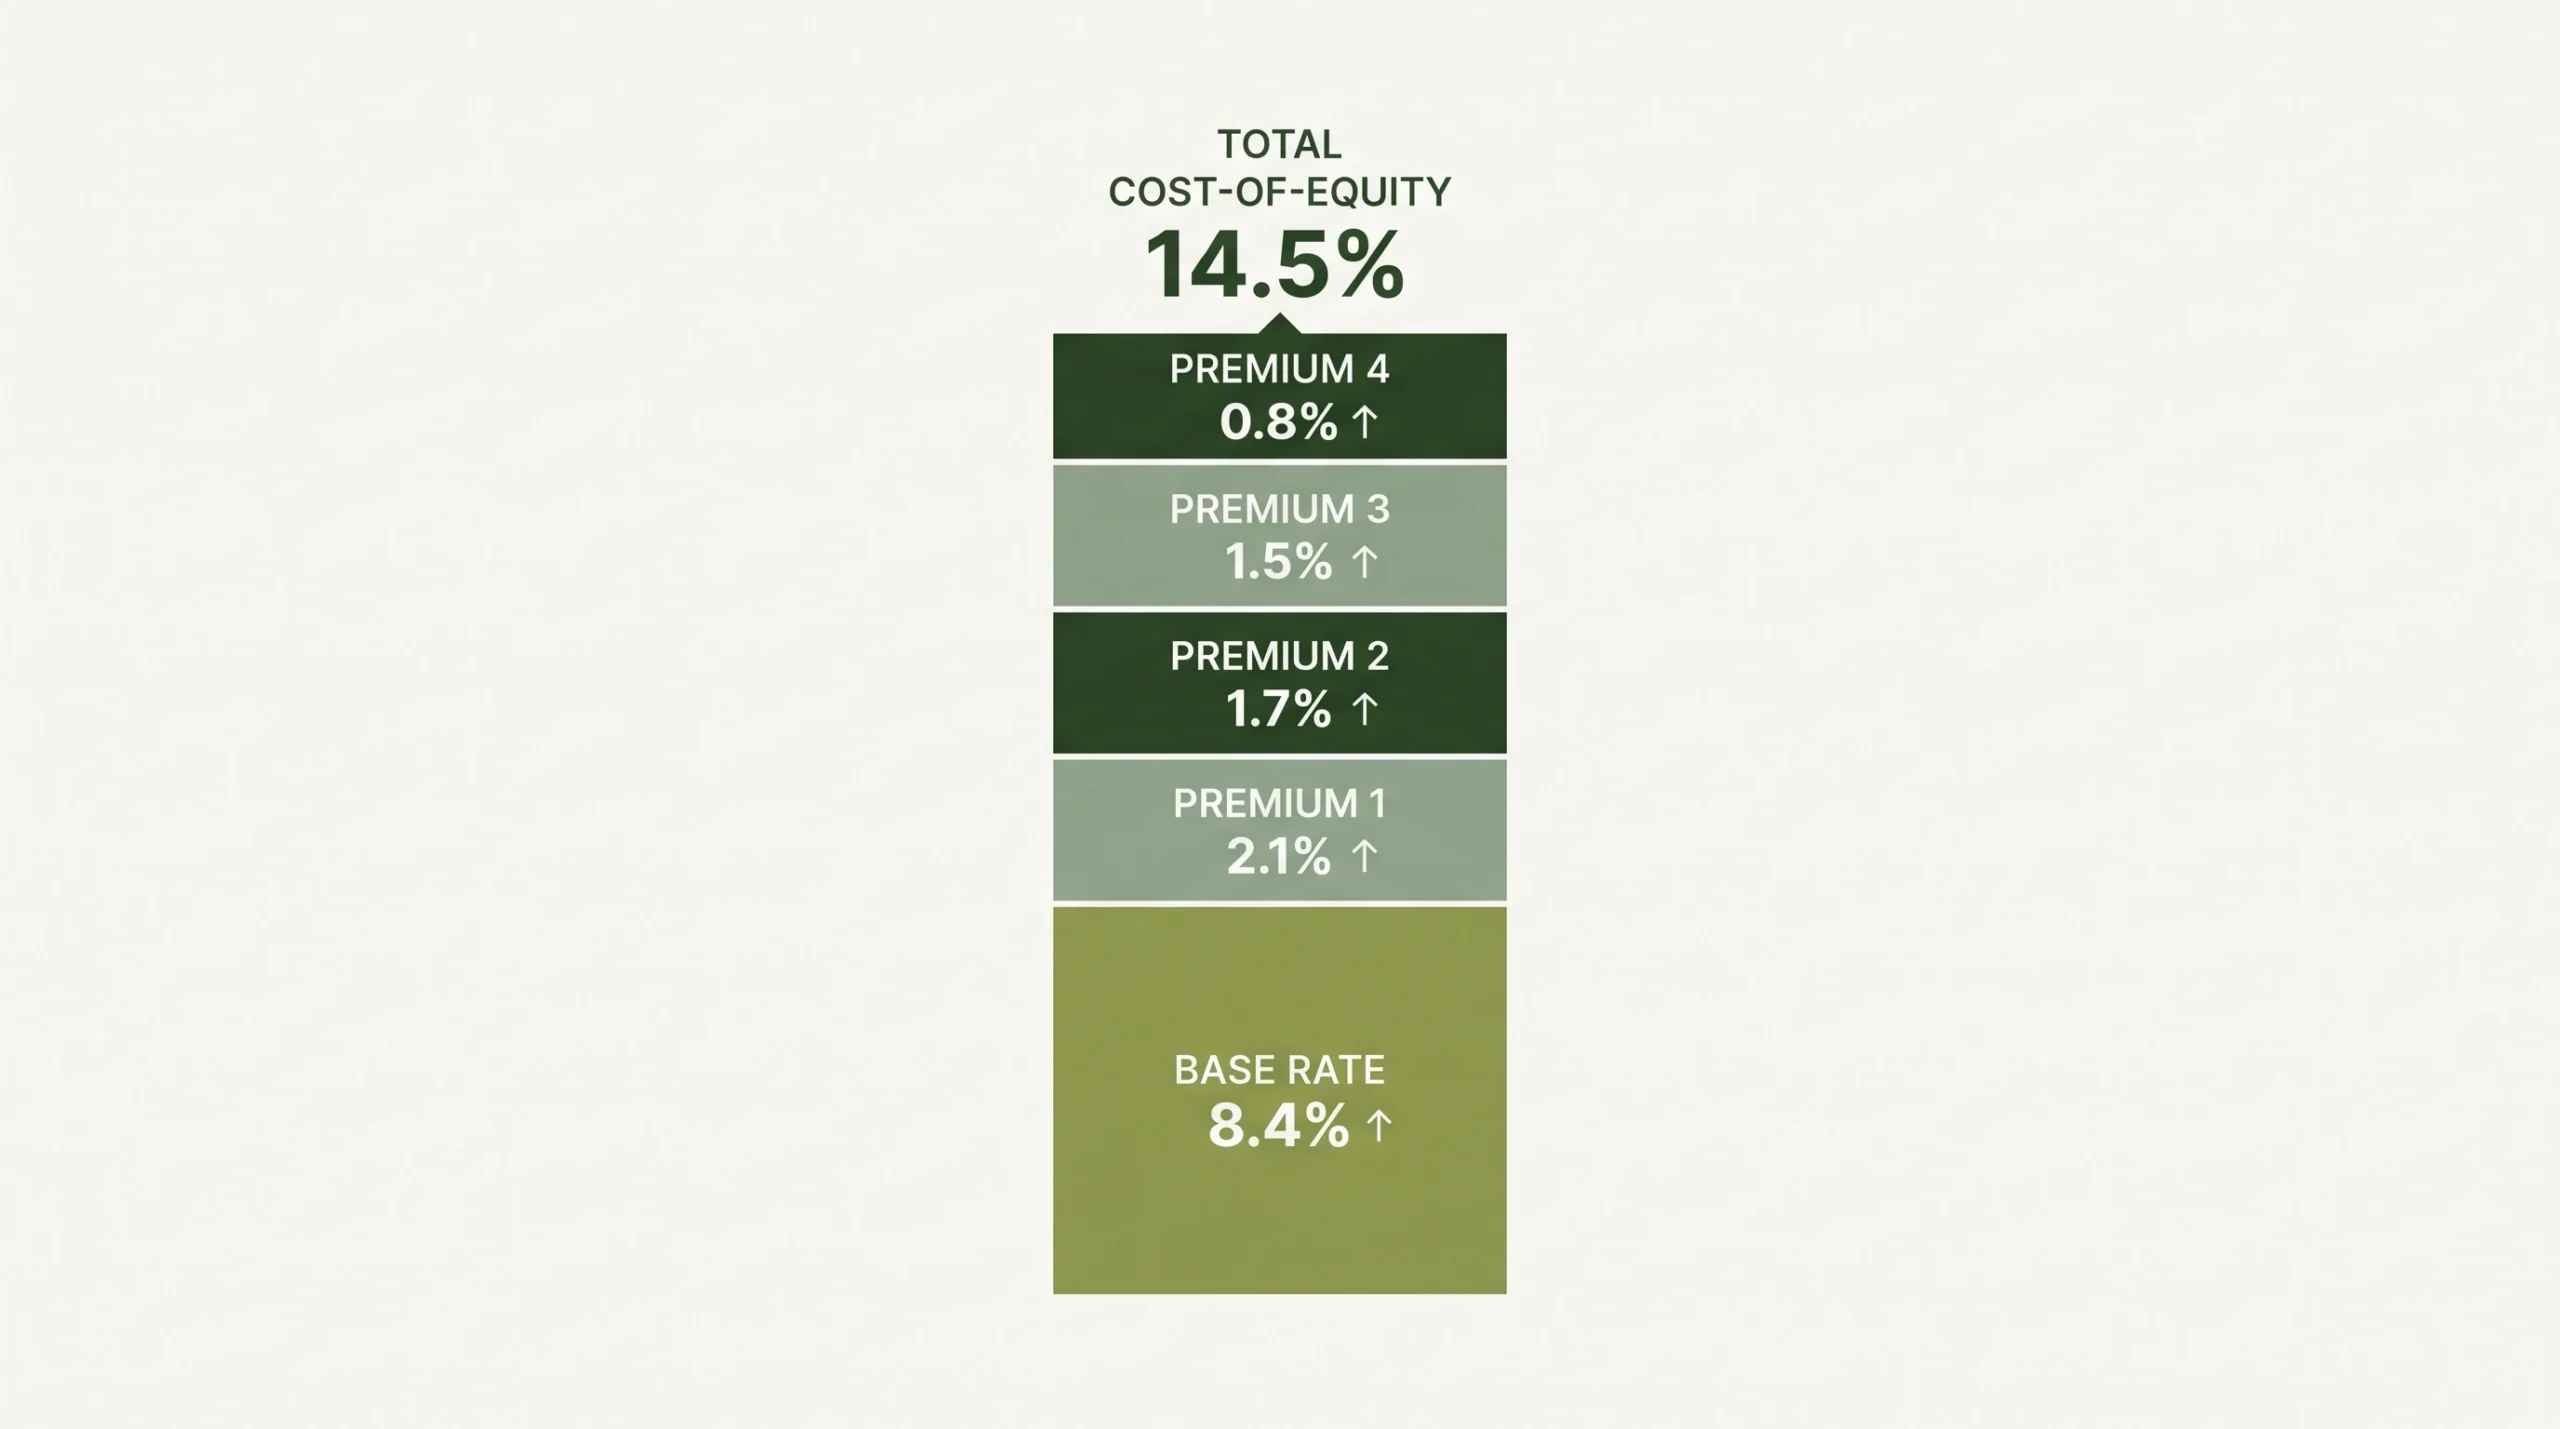
The build up method formula is the risk-free rate plus the equity risk premium, the size premium, the industry premium, and the company-specific risk premium. Each term adds a layer of risk that a private buyer takes on. Add them together and you get the cost of equity. That figure is the return an investor should expect for the risk. It becomes the discount rate in a valuation.
The order matters less than the logic. You start with a safe base return, then pay for each added risk. A government bond sets the floor. Stocks carry more risk than bonds, so the equity risk premium comes next. Small firms are riskier than large ones, so a size premium follows. The last premium reflects the single company itself. Sofer Advisors ties every layer to market evidence and, true to its Heart of a Teacher approach, shows the owner the math behind each one.
How do you find the risk-free rate?
You find the risk-free rate from the yield on a long-term U.S. Treasury bond. Most analysts use the 20-year bond as the benchmark. Its term lines up with the long life of a business. The yield shows what an investor earns with almost no default risk. That makes it a clean starting point for the whole build up.
The rate is not fixed. It moves with the bond market, so our team checks current yields for each job. A stale rate would throw off the final cost of equity. When the economy is steady, the Treasury yield gives a fair, neutral base. We record the source and date, so a reviewer can trace the number. This keeps the model in step with real market rates rather than a guess.
What is the equity risk premium?
The equity risk premium is the extra return investors want for holding stocks over safe bonds. It pays for the risk that comes with the whole stock market. Analysts pull this figure from long-run market data. The Kroll Cost of Capital Navigator is a common source. Add the premium to the risk-free rate, and you have the base return for equity.
This premium is market-wide, not firm-specific. It reflects broad risk, not the traits of one company. A sound source matters here, since the figure shifts over time. An old premium can skew the result by a full point or more. Our team uses current, published data so the rate reflects today’s market. The premium then feeds the next layers, which narrow the focus to size and the single firm.
How are the size and specific premiums set?
The size premium comes from market data sorted by company size. Smaller firms have earned higher returns, so they carry a larger premium. The Kroll Cost of Capital Navigator groups this data by size band. Completed private deal evidence can cross-check the result. The company-specific risk premium is different. It rests on judgment about one firm, not on a broad table.
For size, our analysts match the subject firm to the right band and read the premium. That part is grounded in numbers. The last layer takes more care. We weigh risks that market averages miss, such as customer concentration, thin management depth, or reliance on one owner. Each risk raises the premium a set amount. This is where The Sofer Difference shows: a four-phase process of Discovery, Diligence, Analysis, and Delivery that documents every choice. The result is a rate an owner, a buyer, or a court can follow.
How does it differ from CAPM?
The build up method and CAPM both find the cost of equity. The difference is how they measure risk. CAPM uses a single beta from public stock prices. A private firm has no traded stock, so no beta exists. The build up method skips beta and adds clear premiums instead. That is why it fits private companies so well.
| Method | How it measures risk | Key inputs | Best for |
|---|---|---|---|
| Build-up method | Stacked risk premiums | Risk-free rate, equity, size, industry, and specific premiums | Private firms with no traded stock |
| CAPM | A single beta from market prices | Risk-free rate, equity risk premium, beta | Public firms with a price history |
| Weighted average cost of capital | Blended cost of debt and equity | Cost of equity, cost of debt, capital weights | Firms that carry meaningful debt |
The choice depends on the company and the data at hand. A public firm with a long price record can support CAPM, since its beta is real. A private firm cannot, so the build up method gives a firmer answer. Large advisers such as Alvarez and Marsal or Stout run these models for big clients. Sofer Advisors brings the same senior-level rigor to middle-market owners, and unlike a solo practitioner, backs each rate with database evidence. IRS Revenue Ruling 59-60 and AICPA SSVS both call for this kind of grounded, documented work.
What does a sample calculation show?
A sample build up shows how the layers stack into one rate. Suppose the risk-free rate is 4.5 percent. Add a 5.5 percent equity risk premium, a 4 percent size premium, a 1 percent industry premium, and a 2 percent company-specific premium. The total cost of equity is 17 percent. That rate would then discount the firm’s future cash flow.
The numbers here are only an illustration, not a fixed benchmark. Real inputs shift with the market and the firm. Still, the example shows the logic clearly. Each layer answers a plain question: how safe is the base, and how risky is this firm? A larger, steadier company would carry lower premiums and a lower rate. A small, single-owner firm would carry higher ones. Sofer Advisors sets each figure from current data, so the final rate reflects the real business and stands up in an audit or a deal.
Frequently Asked Questions
What is the build-up method in plain terms?
The build up method is a way to find the return an investor needs from a private firm. You start with a safe base rate, then add a premium for each added risk. The layers cover market risk, small size, the industry, and the single company. Added together, they give the cost of equity. Sofer Advisors uses this method when a firm has no public stock to measure.
What are the parts of the build-up method?
The method has five parts. The risk-free rate sets the base. The equity risk premium pays for stock market risk. The size premium covers the extra risk of a smaller firm. The industry premium reflects sector risk. The company-specific premium captures traits unique to the firm, such as customer concentration. Our team sizes each part from market data or documented judgment.
How is the build-up method different from CAPM?
CAPM finds the cost of equity from a single beta, which measures how a stock moves against the market. A private firm has no traded stock, so no beta can be found. The build up method solves this by adding clear risk premiums instead of a beta. Both start from a risk-free rate and an equity risk premium. The build up method simply fits firms with no public price history.
Where does size premium data come from?
Size premium data comes mainly from the Kroll Cost of Capital Navigator. It tracks historical returns across bands of company size. Smaller firms have earned higher returns, so they carry a larger premium. Analysts match the subject firm to the right band and read the figure. Sofer Advisors relies on this recognized source to keep each size premium neutral and consistent across reports.
What is a company-specific risk premium?
A company-specific risk premium is the last layer in the build up. It covers risks that market averages miss. Common ones include reliance on a single owner, a narrow customer base, or thin management depth. Because these traits differ by firm, the premium rests on expert judgment, not a fixed table. Our team weighs each risk during the Diligence phase and records the reason for every point added.
What is a typical company-specific premium range?
The company-specific premium is subjective, but it often falls between 0 and 5 percent. The exact figure depends on real risks in the business, such as key person reliance or customer concentration. A stable firm with a deep team sits at the low end. A fragile, owner-dependent firm sits higher. David Hern CPA ABV ASA and his team document the basis for each figure so it holds up under review.
Can you use the build-up method for a public company?
You can, but it is rarely the best fit. A public company has a long price history, so a real beta can be found. That makes CAPM the more direct choice for those firms. The build up method shines when no traded stock exists and beta cannot be measured. Sofer Advisors matches the method to the data, so the rate reflects the firm’s real profile.
How is the cost of equity used after you find it?
Once you have the cost of equity, it becomes the discount rate in a valuation. In a discounted cash flow model, that rate turns future cash flow into present value. A higher rate means more risk and a lower value today. The figure can also feed a weighted average cost of capital when the firm carries debt. The rate you build directly shapes the final number.
How much does a business valuation from Sofer Advisors cost?
Business valuations from Sofer Advisors typically run from 7,500 to 25,000 dollars. The price depends on the complexity of your finances and the purpose of the work. Simpler jobs for planning or tax sit toward the lower end. Deals and litigation support need deeper analysis, so they run higher. Contact Sofer Advisors for a fee quote matched to your situation.
Related Case Studies
- The Size Premium: Why Small Firms Carry Higher Rates
- Company-Specific Risk Premium: How It’s Sized
- Equity Risk Premium: How It Sets Cost of Equity
Executive Summary
The build up method sets a private firm’s cost of equity by stacking risk premiums on a risk-free rate. A sample stack might reach 17 percent: a 4.5 percent base plus premiums for market, size, industry, and company risk. Size premiums alone range from under 1 percent to more than 5 percent, per the Kroll Cost of Capital Navigator. The method fits firms with no public beta, where CAPM falls short. The final rate discounts future cash flow into present value. Sofer Advisors grounds each layer in market data, so the result meets IRS Revenue Ruling 59-60 and AICPA SSVS.
What Should You Do Next?
Start by gathering three years of financial statements and details on your customers and leadership. Next, decide the purpose of the valuation, since a rate for planning may not survive IRS or court review. Then match each premium to current market data rather than a generic figure.
For a cost of equity you can defend, work with David Hern CPA ABV ASA. His team has given expert witness testimony in 11+ cases across Georgia, Florida, California, and New Mexico. Schedule a consultation to discuss the right method for your business.
People Also Read
About the Author
This guide was prepared by David Hern CPA ABV ASA, founder of Sofer Advisors, a business valuation firm headquartered in Atlanta, GA serving clients across the United States. David holds dual accreditations as an Accredited Senior Appraiser (ASA) and is Accredited in Business Valuation (ABV), credentials recognized by the IRS, SEC, and FINRA. He also holds the Certified Exit Planning Advisor (CEPA) designation. With 15+ years of valuation experience, David has served as an expert witness in 11+ cases across multiple jurisdictions and built Sofer Advisors into an Inc. 5000-recognized firm with 180+ five-star Google reviews. Its full W2 employee team maintains subscriptions to all major valuation databases and operates under a next business day response policy. For professional business valuation services, visit soferadvisors.com/about-us/ or contact Sofer Advisors at soferadvisors.com/contact-us/.
Disclaimer: This content is for informational purposes only and does not constitute professional valuation advice. Business valuation conclusions depend on specific facts and circumstances. Contact Sofer Advisors for guidance regarding your specific situation.