


Last Updated: June 2026
A trucking company is typically valued at 3x–6x EBITDA for over-the-road (OTR) carriers. Specialized haulers command 4x–7x EBITDA. These include hazmat, refrigerated, flatbed, and oversize load carriers. The niche creates clear pricing power and customer stickiness. Non-asset-based freight brokers and 3PLs are valued differently. They generally trade at EBITDA multiples of 5x–9x. The absence of fleet ownership creates a lighter capital structure and a more scalable margin profile.
The 2026 freight rate environment remains challenging. The freight recession that began in late 2022 produced prolonged rate compression across most truckload segments. There are signs of a cyclical recovery. But spot rates are still below peak levels. This environment has compressed valuations for commodity OTR carriers. Buyers are applying tighter multiples and heavier due diligence on customer focus and covenant compliance. Specialized carriers with dedicated contracts and niche lane authority have held valuations better. Sofer Advisors helps owners and their advisors work through exactly these questions and turn the analysis into a defensible business valuation they can act on.
The following takeaways summarize the key valuation and transaction factors covered in this guide.
Key Takeaways
- OTR Trucking Companies Typically – OTR trucking companies typically sell for 3x–6x EBITDA. Specialized carriers with dedicated contracts command 4x–7x.
- Nonasset Freight Brokers 3PLs – Non-asset freight brokers and 3PLs trade at 5x–9x EBITDA. Their asset-light model and scalable margin structure justify a higher multiple than asset-heavy carriers.
- Fleet Age Matters Fleet – Fleet age matters – a fleet with average age above 5–6 years carries a capital expenditure liability. Buyers will discount this from the purchase price.
- Driver Turnover Industry Average – Driver turnover above the industry average signals working instability. Well-managed smaller carriers often show 30%–50% turnover, which is a meaningful positive differentiator.
- Customer Focus 25 30 – Customer focus above 25%–30% of revenue in any single shipper is a deal risk. Buyers will model revenue at risk and adjust price or structure.
- 2026 Freight Rate Environment – The 2026 freight rate environment favors specialized carriers and those with dedicated contract exposure over spot-market-dependent OTR carriers.
Each of these factors is examined in depth in the sections that follow.
What EBITDA Multiples Do Trucking Companies Command in 2026?
Trucking valuations center on EBITDA, with adjustments for owner pay, fleet depreciation, and one-time items. The table below shows 2026 valuation benchmarks by carrier type and business model:
| Carrier Type | EBITDA Multiple | Revenue Multiple | Notes |
|---|---|---|---|
| OTR truckload, spot-market dependent | 2.5x–4x | 0.3x–0.5x | Freight recession discount |
| OTR truckload, dedicated contract | 4x–6x | 0.5x–0.7x | Contract stability premium |
| Specialized (hazmat, reefer, flatbed) | 4x–7x | 0.6x–0.9x | Niche pricing power |
| LTL carrier (owned terminals) | 5x–8x | 0.8x–1.1x | Infrastructure premium |
| Non-asset freight broker / 3PL | 5x–9x | 0.8x–1.2x | Asset-light scalability |
| Owner-operator fleet (SDE basis) | 2.5x–3.5x SDE | N/A | Small fleet, key-person risk |
SDE (Seller’s Discretionary Earnings) is used for smaller, owner-operated carriers. For any carrier with management and $1M+ EBITDA, buyers use EBITDA as the base metric.
Revenue multiples are a secondary screen. Buyers typically use them as a sanity check, not the primary valuation method. Revenue multiples compress when margins are thin. This is common in OTR spot market carriers at 3%–7% EBITDA margin. They expand when a carrier’s niche commands premium working ratios (OR below 85%).
Working ratio (OR), total working costs divided by total revenue, is the standard efficiency metric in trucking. An OR of 90% means the carrier is generating a 10% working margin. Best-in-class specialized carriers achieve OR of 82%–88%. Buyers purchasing carriers with OR above 95% are buying at a deep discount or underwriting a turnaround.
A market multiple is a starting point, not a conclusion of value. A defensible fair market value still rests on the factors the IRS sets out for valuing closely held businesses under Revenue Ruling 59-60.
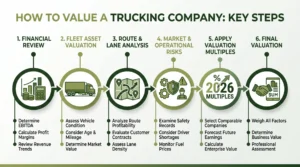
How Does the Asset-Based Versus Non-Asset Model Affect Valuation?
The split between an asset-based carrier and an asset-light model is the most fundamental driver of valuation method. Asset-based carriers own trucks and trailers. Asset-light models include freight brokers, 3PLs, or owner-operator fleets.
Asset-based carriers have balance sheets dominated by fleet and equipment. Buyers must assess whether the balance sheet fleet value supports or burdens the deal. A carrier with a modern fleet (3–5 year average age) presents book value that approximates fair market value. A carrier with an aging fleet (7+ years) presents latent capital expenditure. The buyer will need to spend $150,000–$200,000 per truck to replace aging equipment over the next 3–5 years.
Fleet age adjustment is typically modeled as follows: buyers estimate replacement cost net of book value. They discount it at an appropriate rate. They then deduct the net present value of required capex from the enterprise value. A fleet requiring $3M in replacement over 5 years might reduce a buyer’s offer by $1.5M–$2M in present value terms. Sellers who fail to account for this are surprised when offers come in below their expectations.
Non-asset freight brokers are valued differently. Their assets are minimal, a CRM, load board relationships, carrier agreements, and a skilled dispatch team. Margins in freight brokerage are lower in absolute terms. Gross margin typically runs 12%–20% on gross revenue. But the EBITDA conversion is high when the business scales. PE buyers running freight brokerage rollups pay 5x–9x EBITDA for brokers with $500K+ EBITDA and diverse carrier relationships. The key due diligence focus is on carrier diversity, customer focus, and whether the sales team has non-solicitation agreements.
How Does a $500,000 Revenue Trucking Business Compare to a $5M Revenue Carrier?
A $500,000 revenue trucking company is almost certainly owner-operated. If the owner-driver is clearing $80,000–$120,000 in SDE after all working costs, a buyer would typically pay 2x–3x SDE. That works out to $160,000–$360,000. At this scale, the “business” is primarily a job and a truck. The multiple reflects key-person risk, fleet risk, and limited customer spread.
A $5M revenue carrier with $500,000 in EBITDA (10% margin) has a different profile entirely. With dedicated customer contracts, employed drivers, and a management layer beyond the owner, a buyer might pay 4x–5x EBITDA. That is $2M–$2.5M. At this level, the business has real scalability. The multiple reflects it.
The “3x profit” rule of thumb circulates in small business sale conversations. It is a rough rule for small owner-operated businesses. It is not how buyers value trucking companies with $1M+ EBITDA. Those buyers use EBITDA multiples calibrated to the specifics of the carrier.
For sellers: EBITDA adjustment is the most important step before going to market. Removing personal expenses, adding back one-time costs, and adjusting owner pay to market-rate replacement can greatly change the earnings base. A carrier “making $300,000” before adjustment may show $500,000 in adjusted EBITDA after adding back personal expenses and one-time maintenance costs. That difference can be worth $600,000–$1,000,000 in purchase price at a 4x–5x multiple.
David Hern CPA ABV ASA, founder of Sofer Advisors, brings a Heart of a Teacher to every engagement – translating complex valuation methodology into clear, actionable guidance that clients can act on before and after the report is delivered. With 15+ years of valuation experience, 11+ expert witness cases across multiple jurisdictions, and 180+ five-star Google reviews, David built Sofer Advisors into an Inc. 5000-recognized firm. The Sofer Difference is a four-phase process of Discovery, Diligence, Analysis, and Delivery that ensures every conclusion is defensible, documented, and tied to the specific facts of the business.
While national firms like Stout and Kroll serve large enterprise clients, Sofer Advisors specializes in middle-market businesses that require personalized attention, direct access to credentialed professionals, and a next business day response policy.
What Is the Impact of Driver Turnover and Fuel Costs on Value?
Driver turnover is the chronic working challenge in trucking and a large valuation variable. The American Trucking Associations reports annualized turnover rates of 85%–100%+ for large TL carriers. Each driver departure costs $3,000–$15,000 in recruiting, onboarding, and lost productivity. High turnover also signals safety culture issues.
For smaller carriers, 10–50 trucks, buyer focus on driver turnover is acute. A carrier with a tenured driver base (2+ year average tenure) presents a fundamentally lower working risk profile. Above-market pay and documented safety metrics also help. Buyers model driver cost as a percentage of revenue. Carriers with turnover-driven recruiting costs of 3%–5% of revenue face effective margin compression that reduces EBITDA.
Fuel expense represents 25%–35% of revenue in most OTR trucking operations. Buyers examine fuel hedging programs and fuel surcharge pass-through mechanisms. Carriers that have negotiated effective fuel surcharge clauses with customers have protected their margins in volatile environments. Carriers without effective fuel surcharges are more exposed to commodity cost volatility. Buyers view this as earnings risk.
Owner-operator fleets, where drivers are independent contractors rather than employees, have a different cost and risk profile. Owner-operators absorb fuel and maintenance costs in their rate, creating a variable cost model. But IRS and Department of Labor scrutiny on worker classification has increased. Buyers reviewing owner-operator models will check classification compliance carefully. They may require representations and warranties insurance to cover misclassification exposure.
How Do PE Buyers Evaluate a Trucking Company Acquisition?
PE buyers in the trucking sector approach purchases with a specific underwriting model. They are primarily active in three segments: specialized carriers (hazmat, reefer, LTL), freight brokerage/3PL rollups, and last-mile delivery. OTR commodity truckload is generally less attractive to PE buyers due to thin margins and rate cycle exposure.
The PE underwriting model for trucking typically includes: adjusted EBITDA calculation (3-year average, adjusted for one-time items), working ratio analysis by business segment, and customer contract review. Contract terms, renewal dates, and rate adjustment clauses are all reviewed. Fleet age and replacement capex schedules are also part of the model. Driver workforce analysis and regulatory compliance review round out the process. These include DOT safety ratings, CSA scores, and insurance claims history.
CSA (Compliance, Safety, Accountability) scores from FMCSA are a critical due diligence input. Carriers with elevated CSA scores in Unsafe Driving, Hours of Service Compliance, or Vehicle Maintenance face insurance surcharges. They may also be disqualified from customer contracts. A “Satisfactory” DOT safety rating with clean CSA scores supports a premium valuation. A “Conditional” rating or elevated CSA alerts triggers a discount or a condition before closing.
Lane specialization is the clearest path to a premium multiple. Carriers with established authority, customer relationships, and working expertise in hazmat, oversize/overweight, refrigerated produce, or intermodal drayage command premium pricing from customers. They also command premium valuations from buyers. The combination of regulatory barriers to entry and customer stickiness creates a defensible competitive position. This justifies a 1x–2x EBITDA multiple premium over commodity OTR.
The questions below address the most common issues business owners raise before engaging a qualified appraiser for a trucking company valuation engagement.
Frequently Asked Questions
How is a trucking company valued differently from other businesses?
Trucking valuations require adjustments specific to the industry: fleet age and replacement capex discounts, working ratio analysis, driver retention metrics, CSA score review, and fuel surcharge contract analysis. A generic business valuation method misses these industry-specific value drivers and risk factors.
What is an owner-operator trucking business worth?
A single owner-operator running one truck typically generates $80,000–$150,000 in SDE. At a 2x–3x SDE multiple, the business value is $160,000–$450,000. The truck and trailer have more asset value. Total sale price including equipment is often $250,000–$600,000 depending on truck age and contracts.
Does a trucking company’s DOT safety rating affect its sale price?
Yes, greatly. A “Satisfactory” DOT rating with clean CSA scores is table stakes for a full-price deal. A “Conditional” rating triggers buyer concern about insurance costs, customer contract risk, and regulatory remediation expense. All of these are discounted from the purchase price.
How does lane specialization affect trucking company value?
Lane specialization, particularly hazmat, oversize/overweight, refrigerated, or dedicated lanes for specific shippers, creates pricing power and switching costs. This justifies 4x–7x EBITDA multiples versus 3x–4x for commodity OTR. Specialized authority, permits, and equipment represent barriers to entry that buyers value.
What is the impact of the 2026 freight rate environment on trucking valuations?
The prolonged freight rate cycle of 2022–2026 has compressed spot-market OTR valuations and tightened buyer multiples. Carriers with dedicated contract exposure have held valuations better. Buyers are applying conservative revenue projections in their DCF models and adjusting to sustainable contract rates.
Should I do an asset sale or stock sale for a trucking company?
Most trucking purchases are structured as asset sales. Buyers want to inherit specific working authorities, equipment, and customer contracts without assuming unknown liabilities. Stock sales are more common for larger, institutionally-managed carriers where the buyer wants to retain the entity’s certificates, permits, and contracts intact.
How do freight brokers compare to asset carriers in terms of valuation?
Non-asset freight brokers typically trade at higher EBITDA multiples (5x–9x) than asset-based carriers (3x–6x OTR). Their asset-light model generates higher returns on capital. It also scales without the capital expenditure burden of fleet ownership. But broker businesses with heavy customer focus or thin gross margins may trade at the lower end of this range.
What financial records do trucking company buyers require?
Three years of P&L statements and tax returns, monthly driver settlement reports, fuel purchase records and surcharge analysis, customer contract files, equipment titles and loan schedules, DOT safety inspection records, CSA score history, insurance claims history, and carrier authority records.
Related Case Studies
- Manufacturing Company Valuation Georgia Complete Industry Guide
- Construction Company Valuation Georgia Complete Industry Guide
- Selling A Business In Georgia Complete Exit Planning Guide 2026
Executive Summary
- Trucking company EBITDA multiples range from 2.5x–4x for spot-dependent OTR carriers to 4x–7x for specialized haulers with dedicated contracts.
- Non-asset freight brokers and 3PLs command 5x–9x EBITDA due to their lighter capital structure and more scalable margin profile.
- Fleet age, driver turnover, DOT safety ratings, and CSA scores are industry-specific value drivers that a general business valuation may miss.
- The 2026 freight rate environment has suppressed commodity OTR valuations. Specialized carriers with contract revenue have held multiples better.
What Should You Do Next?
If you own a trucking or freight company and are considering a sale, succession plan, or need a valuation for a partner buyout or SBA financing, the industry-specific details of your operations determine your valuation outcome. David Hern CPA ABV ASA, founder of Sofer Advisors, holds dual ASA and ABV credentials recognized by the IRS, SEC, and FINRA, with 15+ years of valuation experience and 180+ five-star Google reviews. Schedule a consultation to discuss your business valuation needs.
People Also Read
- Technology Company Valuation Methods A Complete Guide
- Technology Company Valuation Atlanta Guide For Startups And Growth Companies
About the Author
This guide was prepared by David Hern CPA ABV ASA, founder of Sofer Advisors – a business valuation firm headquartered in Atlanta, GA serving clients across the United States. David holds dual accreditations as an Accredited Senior Appraiser (ASA) and is Accredited in Business Valuation (ABV), credentials recognized by the IRS, SEC, and FINRA. He also holds the Certified Exit Planning Advisor (CEPA) designation. With 15+ years of valuation experience, David has served as an expert witness in 11+ cases across multiple jurisdictions and built Sofer Advisors into an Inc. 5000-recognized firm with 180+ five-star Google reviews. The firm’s full W2 employee team maintains subscriptions to all major valuation databases and operates under a next business day response policy.
For professional business valuation services, visit soferadvisors.com/about-us/ or schedule a consultation at soferadvisors.com/contact-us/.
Disclaimer
This content is for informational purposes only and does not constitute professional valuation advice. Business valuation conclusions depend on specific facts and circumstances. Contact Sofer Advisors for guidance regarding your specific situation.